Observable
A powerful platform for data visualization and collaboration.
Overview
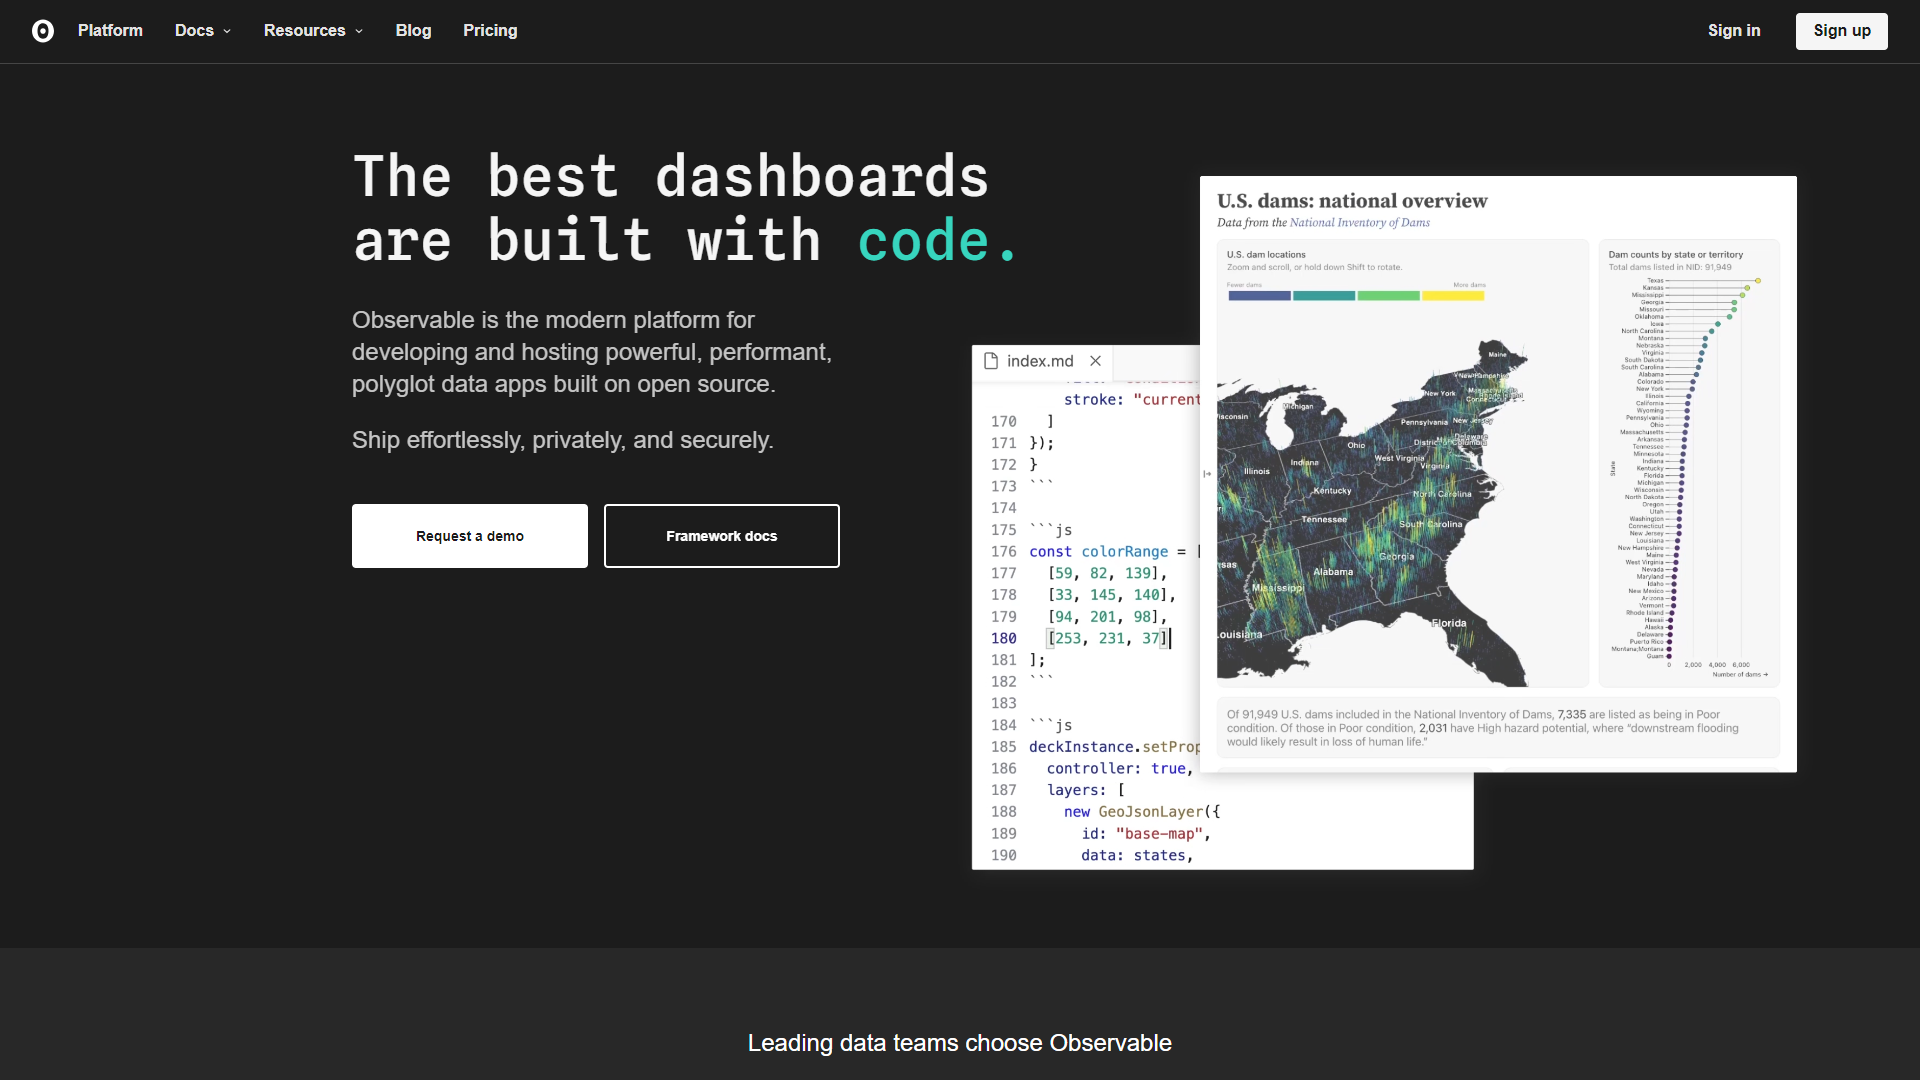
Observable is an innovative platform designed for data scientists, analysts, and anyone interested in visualizing data in a clear and engaging way. It allows users to create interactive data visualizations using JavaScript, making it easier to analyze and present complex data sets. The platform helps users understand their data through live editing and sharing capabilities, encouraging collaboration among teams.
Pricing
| Plan | Price |
|---|---|
| Starter | Free (5 Seat) |
| Pro | $300.00 (10 Seat Per Month) |
| Enterprise | Contact Us (1 Seat Per Year) |
Key features
Interactive Visualizations
Users can create dynamic and interactive charts or graphs that allow for deeper insights into data.
Real-time Collaboration
Multiple users can work on the same notebook simultaneously, making it ideal for team projects.
JavaScript Support
The platform supports JavaScript, which enables advanced data manipulation and visualizations.
Data Importing
Users can easily import data from various sources like CSV files, JSON, or APIs.
Markdown Support
Observable allows users to add descriptive texts using Markdown, enhancing documentation and storytelling.
Version Control
The platform automatically saves versions, making it easy to revert to previous edits if necessary.
Exploration Features
Users can interactively explore data through filtering and zooming functions.
Rich Community
Observable boasts a vibrant community where users can share notebooks, templates, and resources.
Pros & Cons
Pros
- User-Friendly Interface
- Flexible and Powerful
- Active Community
- Real-time Feedback
- Cloud-Based
Cons
- Learning Curve
- Performance Issues
- Limited Offline Access
- Pricing Model
- Dependence on JavaScript
Rating Distribution
User Reviews
View all reviews on G2Best place to write interactive Data Visualization tools
What do you like best about Observable?
Observable's biggest strength is its ability to provide an incredibly rich interactive experience for Data Viz. A lot of Data Viz applications are have too little control over the final product or are walled gardens which cannot be used anywhere else. The focus on code first Data Visualization tooling prvides a really usable experience
I would remiss if I didn't mention the excellent Observable plot, low code data viz library available in the notebooks. That makes it very easy to just drag and drop visualizations
What do you dislike about Observable?
Offline support is a major blocker for our organization. Without offline support, I am unable to use observable for anything more than personal projects
A lack of data processing tooling is an issue as well. Admittedly this is a JS problem and Observable is indeed trying to solve it as well, its still a nagging issue.
Lack of dark mode support is also a bit of a bummer as it becomes difficult to stare at a sharp white surface for long
What problems is Observable solving and how is that benefiting you?
Observables main use case for me is a tool to present results. D3 and Observables unparalleled ability to create rich interactive data applications is often a very effective way of convincing stakeholders of the veracity and applicability of results.
Another use of observable is as a place to write beautiful D3 graphs without using a lot of web tools
Oberservale review for Marketers
What do you like best about Observable?
I like that allows marketers like me to see how their data is being used and to understand the algorithms that are driving their campaigns. I like that it helps mes with insights via a dashboard.
What do you dislike about Observable?
It is sometimes slower th...
Work With Observations
What do you like best about Observable?
I like the workspace navigation. They also offer sample data in which you can retrieve from their library.
What do you dislike about Observable?
Although it do not have much features it will take quite some time to learn the dashboard.
What problems is Obser...
Company Information
Alternative Data Science And Machine Learning Platforms tools
FAQ
Here are some frequently asked questions about Observable.
Observable is a platform for creating interactive data visualizations and collaborating on data analysis projects.
Anyone interested in data visualization, including data scientists, analysts, and educators, can use Observable.
While you can use Observable without JavaScript, having some knowledge will help you unlock its full potential.
Yes, Observable allows real-time collaboration with other users on the same project.
Yes, Observable offers a free version with some limitations, along with paid plans for advanced features.
You can visualize various data types including CSV, JSON, and data from APIs.
Yes, Observable has a vibrant community where users share notebooks and provide support.
Observable offers real-time collaboration, powerful customization options, and an engaging user interface.